Card Centering Impact on Grading Outcomes: An In-Depth Exploration
Explore how card centering impact on grading outcomes affects trade card grades, influencing collector strategies and market value through precise measurements.
Estimated reading time: 8 minutes
Key Takeaways
- Card centering measures the alignment of the printed image relative to the card borders using percentage ratios.
- Strict tolerance bands (e.g., 55/45, 60/40) directly cap top grades like Gem Mint 10 and influence market value.
- Measurement-based criteria bring objectivity and repeatability but introduce steep threshold cliffs.
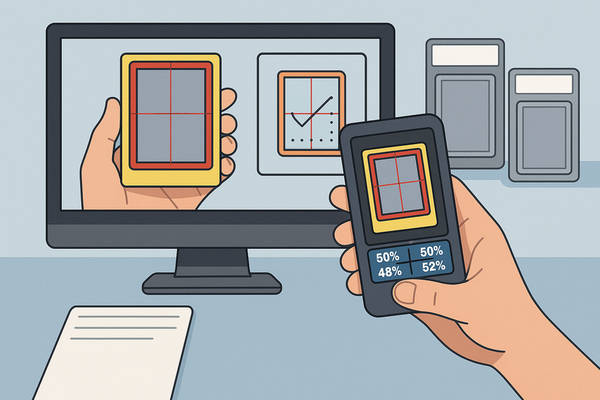
- Collectors and grading services use specialized tools to pre-screen and improve centering before submission.
Table of Contents
- Section 1: Background and Context of Card Centering
- Section 2: Detailed Analysis of Card Centering Impact
- Section 3: Underlying Factors and Theoretical Perspectives
- Section 4: Comparative Studies and Examples of Card Centering
- Section 5: Practical Implications and Future Directions
- Conclusion
Section 1: Background and Context of Card Centering
A. Definition of Card Centering
*Card centering* refers to the alignment of the printed image within the borders of a trading card. Perfect centering is a 50/50 ratio on both axes; hobby standards often accept variances up to 55/45.
- Centering ratios total 100% and express opposite-border widths (e.g., 60/40 is off-center).
- Measured left–right and top–bottom on front (and sometimes back) of the card.
- Rarely perfect; grading companies define acceptable thresholds for each grade tier.
B. Historical Evolution of Centering Practices
Early grading relied on the grader’s eye. Modern practices introduced numeric tolerances:
- PSA Gem Mint 10: front centering must be between 55/45 and 60/40; back up to 75/25.
- Ace Grading centering subgrade assigns scores 1–10 based on precise ratio bands.
- Quantification increased transparency and repeatability.
C. Common Scenarios & Industries
Centering standards play a role in:
- Trading-card grading by PSA, BGS, CGC, Ace (sports, TCGs, etc.).
- Collector pre-screening to predict grade ceilings.
- Print and packaging quality control using similar alignment metrics.
Section 2: Detailed Analysis of Card Centering Impact
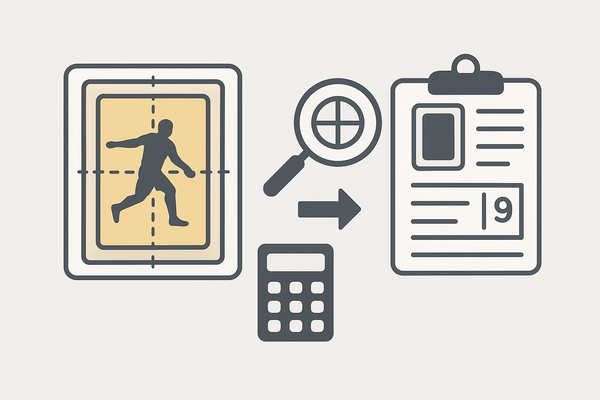
A. Mechanics of Implementation
- Identify reference points (borders, frames, logos).
- Measure distances from image edge to card edge on opposing sides.
- Calculate centering ratio (narrower ÷ total × 100 : wider ÷ total × 100).
- Compare against grade thresholds (e.g., PSA 10 ≤ 60/40 front).
- Assign centering subgrade or cap overall grade if out of tolerance.
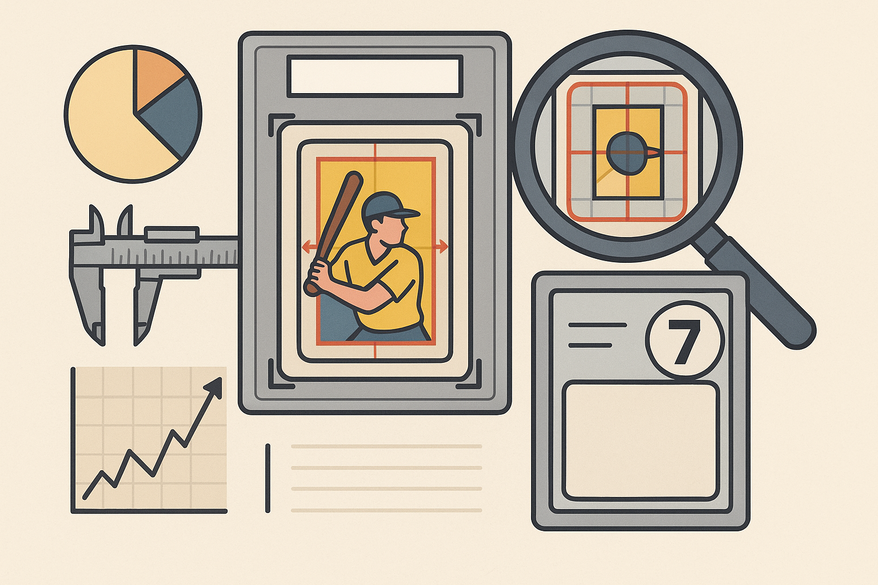
B. Measurable Effects on Grading Outcomes
- PSA 10: requires 55/45 or better on front and back for Mint status.
- PSA 9: around 60/40 front; perfect surface still capped if off-center.
- PSA 8 and below: ≥ 70/30 front or back yields lower tiers.
- Ace Grading: > 60/40 on any axis precludes a 10, assigns 9 or lower.
Even a one-point shift across a ratio threshold can trigger a full-grade drop, affecting value significantly.
C. Benefits: Accuracy, Fairness, Consistency
- Objective, repeatable measurements reduce subjectivity.
- Visual symmetry aligns with collector preferences.
- Published tolerances let submitters pre-screen and avoid fees.
- Uniform rules apply across eras, sets, and grading services.
D. Drawbacks & Challenges
- Borderless or irregular designs complicate reference-point selection.
- Threshold cliffs create all-or-nothing grade caps at narrow ratios.
- Small measurement errors or frame choices can sway the subgrade.
- Visual off-center perception may not align with technical pass/fail.
Section 3: Underlying Factors and Theoretical Perspectives
A. Psychological Drivers
- Human sensitivity to symmetry translates into perceived quality.
- Market feedback loops reinforce centering norms through pricing.
B. Methodological Rationale
Quantification of centering reduces bias and increases perceived fairness among graders and collectors.
C. External Influences
- Card design and border style affect centering visibility.
- Printing-era variability often causes mis-centering on vintage issues.
- Physical gauges versus digital tools can produce different accuracy levels.
Section 4: Comparative Studies and Examples of Card Centering
A. System Comparisons
- PSA 10: ~55/45–60/40 front; PSA 9: ~60/40–65/35 front.
- Ace 10: < 60/40 on both axes for Gem Mint status.
B. Practical Examples
- 55/45 front & 56/44 back → PSA 10; shifting to 61/39 front → capped at PSA 9.
- Ace card with 61/39 centering receives a 9 subgrade despite perfect other attributes.
C. Expert Opinions
- PSA submitter tutorials stress “Gem Mint 10 not to exceed 55/45–60/40 front.”
- Grading-tool creators praise centering gauges for eliminating guesswork.
Section 5: Practical Implications and Future Directions
A. Implications
- Collectors pre-screen centering to estimate grade ceilings and avoid fees.
- Grading firms should publish clear centering tables and visual guides.
- Buyers/sellers must inspect subgrades and scans to understand centering variance.
B. Best Practices
- Use calibrated physical or digital centering tools.
- Maintain public guides translating ratios into visual examples.
- Define reference frameworks for unusual card layouts.
- Provide high-resolution images and explicit centering subgrades.
C. Future Research & Innovation
- AI-assisted centering detection via computer vision.
- Studies on perceptual thresholds to refine tolerance bands.
- Design-specific models for era-dependent printing variability.
- Dynamic reports listing exact measured ratios per axis.
Conclusion
Card centering is quantified by measurable border ratios codified into strict tolerance tables that directly cap or grant top grades like Gem Mint 10. This balance of human symmetry preferences with objective standards ensures fairness and consistency. Understanding centering impact enables collectors to pre-screen submissions, interpret grades accurately, and maximize market value.
FAQ
What is card centering?
Card centering measures how evenly the printed image sits within the card’s borders, expressed as two ratios (e.g., 55/45 front).
How do grading companies measure centering?
Graders identify reference points, measure border widths on opposite sides, calculate percentage ratios, and compare against published thresholds.
Why does centering impact final grades so much?
Strict tolerance bands mean even one-point shifts can cap a card from a 10 to a 9, significantly affecting market value.
How can I improve my chances of a high centering grade?
Use calibrated physical or digital centering tools (e.g., Card Centering Tool) to pre-screen and adjust before submission.