Card Centering Success Stories: How Precision Transformed Card Grading Outcomes
Explore card centering success stories and learn how precision in card grading can transform outcomes, boosting both market values and collector trust.

Estimated reading time: 8 minutes
Key Takeaways
- Precision matters: Small centering differences can make or break a Gem Mint grade.
- Measure, don’t guess: Calipers or pixel counts outperform eyeballing for consistent results.
- Pre‐submission filters: Applying front/back ratio thresholds boosts high‐grade hit rates.
- Standardized processes: Transparent centering criteria build trust and reduce disputes.
- Future readiness: AI and computer vision will automate centering assessment for borderless designs.
Table of Contents
- Introduction
- Background and Context
- Detailed Success Stories
- Analysis of Key Success Factors
- Lessons Learned & Best Practices
- Future Trends in Card Centering
- Conclusion
- FAQ
Introduction
Card centering is the alignment of the printed image relative to the borders of a trading card, expressed as centering ratios such as 55/45 or 60/40. This measurement often determines whether a card achieves a Mint grade or the coveted Gem Mint designation—and whether it sells at a modest price or commands a premium. Accurate centering drives final grade ceilings and shapes collector demand and investment returns.
In this post, we will:
- Showcase real-world case studies
- Analyze critical success factors
- Share lessons and actionable best practices
- Explore future trends in centering technologies
Whether you’re an investor, grading company, or hobbyist, these examples will help you adopt precision processes and unlock higher grading outcomes.
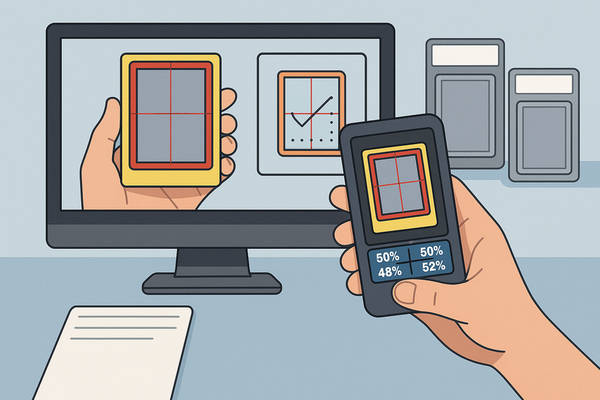
Card Centering Tool is a web app that measures how well‐centered your trading cards are before submission, saving you fees on cards unlikely to reach Gem Mint.
Background and Context
What Is Card Centering?
Card centering refers to how evenly the main image sits between a card’s borders. Grading companies express this as ratios:
- 50/50 – perfect centering, equal borders on opposite sides
- 55/45 – slight but acceptable offset
- 60/40 or worse – visible misalignment that can cap the grade
Measurement methods include rulers or digital calipers for physical cards and pixel-based software on high-resolution scans for remote assessment. For a complete tutorial on manual and digital methods, see our guide: How to Measure Card Centering.
Brief History and Technical Aspects
Centering issues originate during printing and cutting: misaligned plates produce uneven images, and mechanical cutting guides shift sheets unpredictably. Early collectors estimated centering by eye; today, graders use calipers, rulers, and image-analysis tools that convert pixel counts to percentages.
Why Effective Card Centering Assessment Is Crucial
Precise centering assessment is essential because grades can be capped by poor centering even if corners and surfaces are flawless. Collectors pay substantial premiums for symmetry and visual appeal, and consistent centering evaluation builds trust between graders and clients. For detailed tolerances across major graders, check out: PSA vs. BGS vs. CGC Centering Tolerances Compared.
Common Challenges Without Proper Card Centering
Relying on intuition often leads to overpaying for raw cards that never reach target grades, submitting bulk lots with low grade ceilings, and inconsistent subgrades across evaluators. Establishing measurement protocols solves these challenges, as shown in our case studies. If you’re wondering whether a card is off-center before grading, see: Is My Card Off-Center?
Detailed Success Stories (Case Studies)
Case Study 1: Investor’s Pre-Submission Filter
Problem: An investor sent large lots of modern Pokémon cards for grading but achieved only ~15% PSA 10s due to off-center ratios.
Approach:
- Learned PSA centering tolerances: front 55/45, back 75/25
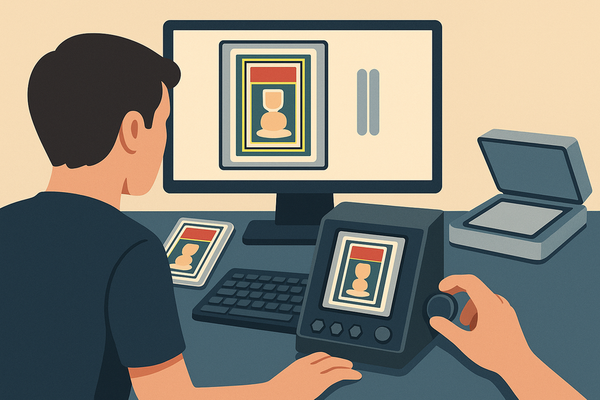
- Scanned each card in high resolution
- Used pixel-count methods to measure border widths
- Created a filter to submit only cards within thresholds
Outcomes:
- PSA 10 hit rate rose to ~40%
- Reduced grading fees on low-ceiling cards
- Higher per-batch profits by focusing on premium submissions
Case Study 2: Grading Company’s Standardization
Problem: A regional grader struggled with inconsistent centering subgrades, causing disputes.
Approach:
- Measured all eight edges with calipers or pixel tools
- Developed software to convert measurements into percentages
- Mapped percentages to a 1–10 centering score
- Trained staff on handling rotated or miscut cards
Outcomes:
- Consistent subgrades across graders
- Fewer resubmissions and higher client satisfaction
- Published transparent centering standards, boosting credibility
Case Study 3: Vintage Collector’s Targeted Grading
Problem: A collector faced a set known for poor centering, unsure which cards to grade.
Approach:
- Researched historical centering distributions
- Measured front/back via ruler, verified borderline cases with pixel tools
- Selected only cards within front 60/40 and back 75/25 limits
Outcomes:
- Graded only the top 15–20% centered cards
- Achieved higher average grades
- Captured the premium on well-centered vintage cards
Case Study 4: Handling Borderless Designs
Problem: Evaluating borderless cards where edges give no clear reference.
Approach:
- Used logos, text boxes, or art elements as anchoring points
- Measured distances from anchors to card edges
- Calibrated measurements against known Gem Mint slabs
Outcomes:
- Reduced mis-buys of off-center borderless cards
- Improved centering subgrades on final submissions
Analysis of Key Success Factors
Methods & Strategies That Drove Success
Standardized measurements, ratio-based criteria, and pre-submission filters emerged as the primary drivers—only submit cards meeting target front/back thresholds.
Role of Innovation, Quality Control & Precision
Digital tools reduce subjectivity via automated border detection, while software-driven score generation ensures consistency—precision matters most near threshold cutoffs.
Technological & Process Improvements
Published centering charts, high-resolution imaging, and online pre-screening platforms are making these workflows more accessible and reliable.
Lessons Learned & Best Practices
Lessons Learned
- Quantify centering with measurements, not by eye
- Know grader-specific front/back tolerances
- Leverage relative centering premiums in poorly centered sets
- Use anchors for borderless designs
Actionable Tips
- Learn key front/back centering ratios for your grading target.
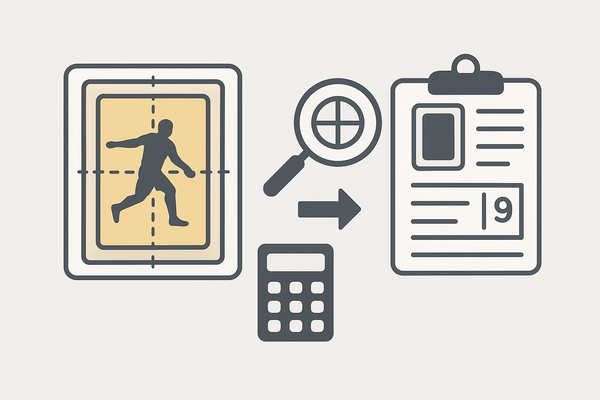
- Measure top/bottom and left/right → calculate % ratio: border width ÷ (sum of both borders) × 100.
- Use digital tools: scan/photo + pixel counts; maintain correct aspect ratio.
- Create a pre-submission centering checklist per grade tier.
- Compare raw cards to known slabs to calibrate your eye.
- Track measured vs. final centering grades to refine thresholds.
Potential Pitfalls & Avoidance
- Don’t rely on intuition alone—always measure.
- Don’t ignore back centering; it can still lower grades.
- Avoid low-res or skewed images for measurement.
- Remember ratios sum to 100 across opposing borders.
Future Trends in Card Centering
Emerging Tech & Trends
AI/computer vision will auto-detect borders and compute ratios, grading firms will publish transparent centering standards, and online pre-screening platforms will deliver automated feedback.
How Innovations Will Shape Success Stories
Expect greater submission efficiency via automated pre-screening, clearer market stratification between true 50/50 and tolerance-meeting cards, and improved evaluation of borderless/experimental designs through logo-recognition algorithms.
Conclusion
Precision, structured processes, and continuous education underpin all card centering success stories. By measuring centering, aligning with grading standards, and applying best practices, you can:
- Improve grading outcomes
- Make smarter buying and submission decisions
- Capture the hidden premium in well-centered cards
Start applying these methods today, track your own results, and share your card centering success stories with the community.
FAQ
- What is the ideal centering ratio?
- The gold standard is 50/50 on the front and back. Ratios up to 55/45 can still achieve high grades depending on grader tolerances.
- How do I measure centering accurately?
- Use calipers for physical cards or high-resolution scans with pixel-count tools. Calculate ratio as border width ÷ (sum of both opposing borders) × 100.
- Can digital tools replace manual calipers?
- Yes—image-analysis software often yields more consistent, objective results, especially for bulk submissions.
- Why does back centering matter?
- Even if the front is perfect, poor back centering can cap the overall grade. Always evaluate both sides.