Graded Card Centering Case Study: How Border Symmetry Drives Grade and Value
Explore the graded card centering case study to understand how border symmetry impacts grades and values, with insights for collectors and grading companies.

Estimated reading time: 7 minutes
Key Takeaways
- Centering (border symmetry) often caps card grades even when other attributes are perfect.
- Pre-measurement using digital tools cuts down submission fees and grading surprises.
- Grading services have distinct front/back tolerance thresholds (e.g., PSA 55/45 front, 75/25 back).
- Small shifts in centering ratios (like 50/50 to 55/45) can trigger 10–20% value differences.
- Transparent ratio reporting builds collector trust and reduces grade disputes.
- Industry momentum favors objective, software-assisted centering calibration.
Table of Contents
- Introduction
- Section 1: Background on Card Grading
- Section 2: Understanding Card Centering
- Section 3: The Graded Card Centering Case Study
- Section 4: Analysis and Lessons Learned
- Section 5: Practical Tips for Collectors and Grading Companies
- Conclusion
- FAQ
Introduction
In this graded card centering case study, we examine how perfect border symmetry can make or break a card’s final grade and resale price. Card centering refers to the measurement of how evenly the printed image sits within a card’s borders, expressed as a ratio (e.g., 50/50 or 60/40). Even when corners are razor-sharp, edges crisp, and surfaces spotless, centering that falls outside tolerance can cause a grading downgrade and a significant hit in collectible value. As grading houses like PSA or Beckett enforce strict front/back symmetry limits, pre-measurement has become a vital step for serious collectors. By the end, you will understand why border alignment is more than aesthetics—it’s a measurable quality gate in professional grading.
For collectors serious about pre-measurement, using a dedicated web app like Card Centering Tool can reveal centering issues with sub-millimeter precision, so you stop wasting submission fees before you send cards off to PSA, BGS, or CGC.
Section 1: Background on Card Grading
Card grading relies on four core attributes:
- Centering (border symmetry)
- Corners (point crispness)
- Edges (trim and cut uniformity)
- Surface (print clarity and blemish absence)
Among these, centering often acts as a “hard ceiling” on final grade because no amount of polishing can correct an off-center print once it’s been cut. Collectors report that even Mint-condition cards can be capped below 10 due to borderline ratios. Industry standards, such as PSA’s tolerance of 55/45 on the front and 75/25 on the back for a PSA 10, have driven many hobbyists to pre-grade their cards. For a detailed walk-through on manual vs. tool-based measurement, see our step-by-step guide.
Section 2: Understanding Card Centering
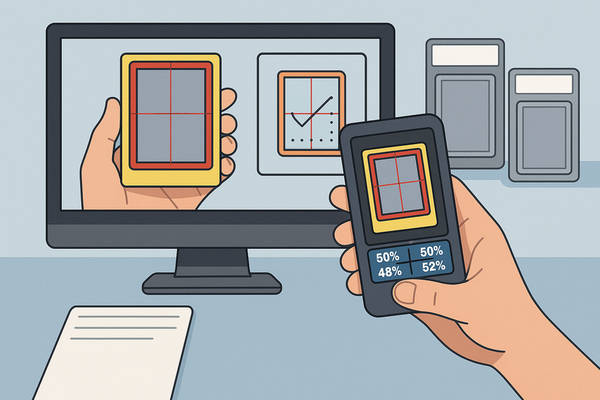
Measurement of centering is a simple ratio: compare opposite border widths left-to-right and top-to-bottom. A 50/50 split means perfect central alignment. A 60/40 ratio shows one side’s border is 50% wider than the opposite, resulting in visible image shift. This ratio-based border analysis is fundamental in grading services worldwide.
Challenges for graders:
- Human estimation can vary by ±2%.
- Lighting, slab reflections, and camera angles can create optical illusions.
- Relying solely on visual checks can lead to inconsistent grades.
Modern centering tools/apps solve these issues:
- Android centering calculator: measures border pixels and computes ratios automatically.
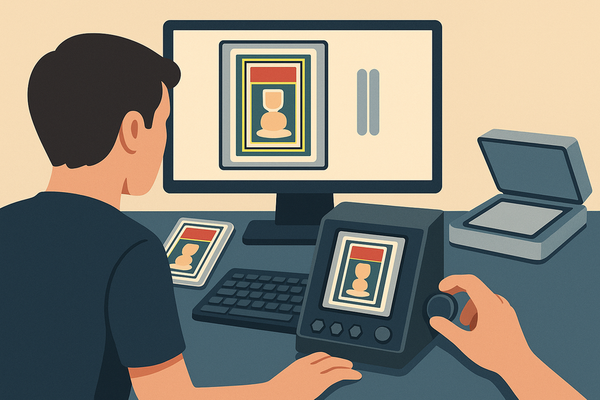
- iOS grading tool: overlays adjustable guides on high-resolution scans.
These tools use image processing and calibration charts to deliver repeatable results. They align with service-specific thresholds so collectors know if their 55/45 front ratio will clear PSA’s 10 cutoff or will be more lenient for other grading companies. To compare centering tolerances across services, check out our detailed breakdown.
Aesthetic and market impacts:
Mis-centering disrupts slab symmetry, diminishing a card’s visual appeal in hand and on screen. On auction platforms, off-center cards often sell at a 5–15% discount compared to identical 50/50 specimens. This margin imbalance directly affects resale value and collector satisfaction.
Section 3: The Graded Card Centering Case Study
Study Framework
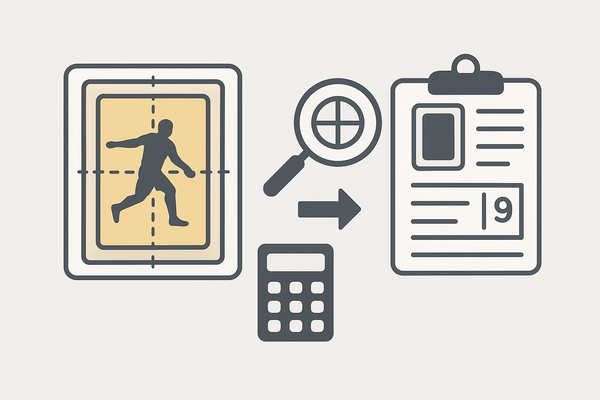
A seasoned collector selects raw cards, measures centering, and predicts grades before submitting for encapsulation. The workflow:
- Raw evaluation: inspect corners, edges, surface.
- Centering measurement: record front/back ratios.
- Submission strategy: send only cards within grade service limits.
- Final grading: compare predicted vs. assigned grade.
Threshold Examples
• 55/45–60/40 front centering may still qualify for top grades depending on service tolerances.
• Cards beyond those limits are capped—often at a 9 or lower—even with flawless other attributes.
CardGrade’s 2026 Data
Among 32,000+ cards graded in 2026, centering was the number-one grade-limiting factor across major companies. Nearly 40% of submitted cards failed to reach predicted grades due to off-center prints.
Before-and-After Scenarios
| Raw Condition | Centering Outcome | Likely Grading Impact |
|---|---|---|
| Near-perfect 50/50 split | Strong centering | Top-grade potential (e.g., PSA 10) |
| Slightly off (55/45–60/40) | Within many service tolerances | High grade if corners/edges/surface are excellent |
| Clearly off (>60/40) | Outside top-tier tolerance | Grade ceiling drops to mid-grade tiers (PSA 8–9) |
Key Lesson
The exact same physical card can earn different final grades solely because of centering standards. A 55/45 card may hit a 10 with one service but fall to a 9 with another. Objective symmetry metrics are decisive quality gates.
Section 4: Analysis and Lessons Learned
Consistent, objective centering measurement enhances grading reliability. When each card is measured with the same digital tool, human variance shrinks, and collector trust grows. Buyers gain confidence knowing similar cards received different grades for clear, data-driven reasons.
Collector Confidence
Transparent ratio reporting lets buyers compare two PSA 10 cards side-by-side, understand why one reached perfection while another missed by 2%. This level of transparency reduces dispute rates and builds marketplace integrity.
Margin Mobility
Small shifts—e.g., moving from a 50/50 to a 55/45 border ratio—can relocate a card from a premium tier (PSA 10) into a standard premium tier (PSA 9). That single shift often carries a 10–20% value delta.
Industry Trend
The hobby is moving toward ratio-based centering charts and company-specific calibration tools. Grading firms publishing clear front/back tolerances and offering collector-facing calculators are setting new standards for fairness and consistency.
Section 5: Practical Tips for Collectors and Grading Companies
For Collectors:
- Use a centering ruler or app to pre-measure on both Android and iOS tools.
- Measure both front and back—grading services evaluate symmetry on both sides.
- Compare results against target service tolerances before submission.
- Employ proper lighting and high-resolution scanning or photography.
- Store cards flat and aligned in sleeves to prevent skewed captures.
For Grading Companies:
- Adopt software-assisted measurement tools to minimize human error.
- Publish clear front and back centering tolerances on your website.
- Offer a free online or in-slab centering calculator for collectors.
- Train graders on consistent calibration methods and regular tool maintenance.
Implementing these steps can drastically reduce grading disputes, improve fulfillment times, and enhance collector satisfaction by ensuring that centering is never a hidden variable. Learn how improved centering can save you fees and boost ROI.
Conclusion
In this graded card centering case study, we saw that border symmetry is often the deciding factor in a card’s grade and market value. By comparing raw measurements to grading-house tolerances, collectors and companies can predict outcomes, avoid surprises, and build trust. As objective centering tools evolve and become standard practice, centering accuracy will remain a cornerstone of grading integrity and collector confidence. Embrace these measurement methods today to ensure every card you submit has the best chance at achieving its true grade.
FAQ
- What is card centering? It’s the ratio of border widths that shows how evenly the image sits within a card’s frame.
- Why does centering matter? Off-center prints can cap the final grade and reduce resale value by up to 15%.
- How can I measure centering? Use a ruler or digital app that calculates left/right and top/bottom border ratios.
- What are PSA’s centering tolerances? For a PSA 10, front borders must be within 55/45 and back within 75/25.
- How do I improve my centering success? Pre-measure cards, use proper lighting, and submit only those within service limits.