Card Centering Analyzer Tutorial: The Ultimate Guide to Accurate Card Grading Prep
Master card centering with our step-by-step analyzer tutorial. Ensure accurate card grading prep by learning to measure border alignment and predict grading.

Estimated reading time: 10 minutes
Key Takeaways
- Master centering measurement: Learn to use digital and physical tools for precise border ratios.
- Predict grading outcomes: Compare centering subgrades across PSA, BGS, CGC, SGC, TAG, and ACE.
- Optimize submission strategy: Screen cards pre-submission to save fees and time.
- Advanced customizations: Tune detection sensitivity, overlay colors, and simulate off-center scenarios.
Table of Contents
- Introduction
- Overview of the Card Centering Analyzer
- Getting Started
- Detailed Tutorial Walkthrough
- Advanced Features & Customizations
- Use Cases & Practical Examples
- Conclusion & Call-to-Action
Introduction
Card Centering Analyzer Tutorial is your step-by-step guide to mastering border alignment measurement for trading and sports cards. A card centering analyzer is a software or physical tool that measures the border alignment of trading or sports cards to predict grading outcomes and inform submission decisions. Such tools scan or overlay measurement guides on your card image to compute centering ratios like 55/45 or 60/40. For more on manual and digital centering techniques, see our how-to guide.
Centering is a critical subgrade metric used by grading services like PSA, BGS, CGC, SGC, TAG, and ACE. Even a slight off-center border can drop a card from gem mint (perfect value) to a lower grade, affecting resale price and collector confidence.
In this tutorial, you’ll learn:
- An overview of how centering analyzers work
- How to set up and install digital or physical tools
- A detailed walkthrough of measuring card borders
- Advanced features, customizations, and grade predictions
- Practical use cases, real-world examples, FAQs, and troubleshooting
Overview of the Card Centering Analyzer
The tutorial begins by explaining the purpose, functionality, features, and common use cases of a card centering analyzer.
Purpose & Functionality
- Modern analyzers leverage AI and image-processing to detect card edges and compute precise border-width ratios (e.g., 55/45 left–right, 60/40 top–bottom).
- They analyze both front and back; grading companies use the worse side’s ratio for final centering subgrade. You can compare tolerances across major graders here.
- Automated perspective correction straightens card images for accurate measurement.
Key Features & Benefits
- Auto-detection with manual fine-tuning guides ensures accuracy.
- Real-time ratio readouts and grade predictions for PSA, BGS, CGC, SGC, TAG, and ACE.
- Scan or upload high-resolution images; visualize off-center areas with color overlays.
- Card management dashboard to save, organize, and reference grading standards.
Common Use Cases
- Pre-grading screening to pick cards likely to earn PSA 10 or BGS 9.5.
- Verifying centering on raw cards from seller photos before purchase.
- Showcasing centering metrics in online listings to boost buyer trust.
- Selecting the most centered copies for high-grade set building.
Getting Started
Before diving in, ensure you meet the prerequisites and understand the interface essentials.
Prerequisites & System Requirements
- Mobile apps (iOS/Android): compatible OS version, camera and storage permissions.
- Web tools: modern browser (Chrome, Safari, Firefox) and stable internet connection.
- Physical measurement tools: clear card borders, strong lighting, non-reflective background.
Accessing/Installing the Tool
Mobile App Steps
- Search “Card Centering Calculator” in App Store or Google Play.
- Tap Install/Get; open the app.
- Grant camera and photo permissions when prompted.
Web Tool Steps
- Visit CardGrade.io/tools/centering or similar web analyzers.
- Click “Upload” or “Capture” to begin analysis—no account required.
User Interface Components
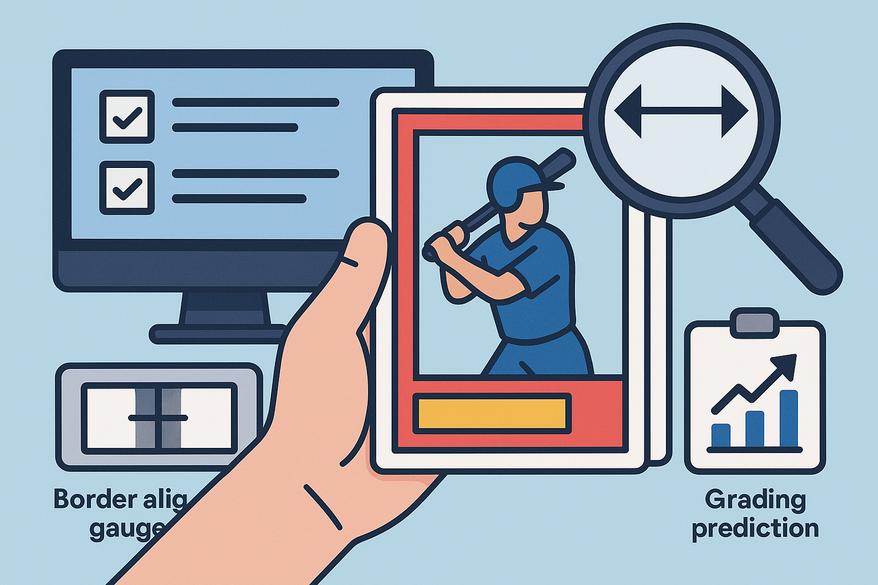
- Preview area: displays your card image.
- Border detection overlays: auto-drawn lines marking edges.
- Draggable measurement guides for fine-tuning border positions.
- Ratio readouts (e.g., “55/45 L–R, 60/40 T–B”).
- Grade prediction panel: displays centering subgrades per company.
- Settings icon: adjust detection sensitivity, grading preferences, overlay colors.
- Save/export button: store analysis data or export results.
- Physical tools include printed scales and percentage guides.
Detailed Tutorial Walkthrough
A step-by-step process for measuring card centering using both digital and physical tools.
4.1 Set Up & Configure
Digital Tool
- Open the app or website; select “New Analysis.”
- Choose input: live camera scan or gallery upload.
- Place an unsleeved card on a solid, contrasting surface; capture a straight-on image.
- Auto-detection runs: correct perspective, detect borders.
- Configure settings: detection sensitivity, grading company profile, overlay colors.
Physical Tool
- Remove protective film; align card behind the centering guide.
- Read side measurements (e.g., left = 2, right = 3); reference percentage chart for ratio.
4.2 Centering a Card in the Interface
- Align card borders parallel to the overlay grid.
- Drag guides to match each border precisely.
- Zoom in for accurate placement; guides should sit on the border edge, not the design.
- Focus on where the white border meets the printed content for consistency.
4.3 Tips & Best Practices
- Maintain consistent photo angles to avoid perspective distortion.
- Take multiple images for borderline cases; compare centering results.
- Remove sleeves to prevent glare; use diffused lighting.
- Manually adjust guides if the auto-detection misplaces edges.
4.4 Common Issues & Troubleshooting
- Border not detected: retake photo, adjust manual guides.
- Inconsistent readings: ensure straight-on shots; test several images.
- Low contrast: use a solid white or black background.
- Sleeve glare: remove sleeve or change light angle.
Advanced Features & Customizations
Unlock pro-level adjustments and tools to refine your centering measurements.
Auto-Detection Tuning
- Adjust sensitivity for thin, thick, or foiled borders to improve AI accuracy.
- Use contrast filters to highlight edges on busy-pattern cards.
Grading Company Profiles
- Toggle PSA, BGS, CGC, SGC, TAG, and ACE standards to see different centering thresholds.
- Compare subgrade possibilities side-by-side.
Off-Center Simulation
- Visualize off-center ratios like 65/35 or 75/25 without scanning a card.
- Use simulation to train your eye on acceptable centering ranges.
UI Customization
- Change overlay colors and guide thickness for maximum visibility on varied card designs.
- Save custom themes for different card types (dark vs. light borders).
Interpreting Results
- Ratio numbers (e.g., 55/45) reflect percent splits; 50/50 means perfect centering.
- The final centering grade uses the worse side (front vs. back).
- Grade prediction panel shows the highest possible centering subgrade.
Performance Optimization
- Establish a consistent photo workflow: same background, lighting, and angle.
- Use a loupe or digital zoom to place guides on pixel-perfect edges.
- Batch-analyze large sets; export data to inventory spreadsheets.
- Compare analyzer results with official grader outcomes to calibrate tool settings.
Use Cases & Practical Examples
Real-world applications demonstrating the value of precise centering analytics.
Example 1 – Pokémon Card Pre-Submission
- Scan front and back of a holographic Pokémon card in the mobile app.
- Analyzer reports 55/45 front, 60/40 back; PSA guidelines indicate potential PSA 10 centering.
- Collector submits directly to PSA, avoiding surprises at grading.
Example 2 – Sports Card Buying Decision
- Upload seller photos of a 1998 baseball rookie card to CardGrade.io.
- Tool reveals 70/30 front centering, outside top-grade range; buyer negotiates price down.
Example 3 – Physical Centering Tool Usage
- Place a raw football card behind a Legends plastic centering guide.
- Read left=2, right=3; consult percentage chart indicating 64/36 centering.
- Card meets BGS 9.5 threshold; seller lists the ratio in their eBay description.
Conclusion & Call-to-Action
In summary, this tutorial has shown you how to:
- Measure precise centering ratios and percent splits
- Compare results to multiple grading standards (PSA, BGS, CGC, SGC, TAG, ACE)
- Make informed submission, buying, and selling decisions based on data
- Utilize advanced features like auto-detection tuning, off-center simulations, and UI customizations
Ready to take your card grading prep to the next level? Share your experiences in the comments below. Subscribe for more expert tutorials on grading preparation—covering centering, corners, surfaces, and submission strategies for PSA, BGS, CGC, SGC, TAG, and ACE.
For even more precision and to eliminate guesswork, try Card Centering Tool, a web app that automatically measures your card's centering before you submit it for grading.
FAQ
Q1: Do I need to remove sleeves?
Yes. For best accuracy, measure an unsleeved card on a plain, non-reflective background.
Q2: Can I measure only the front?
Front-only is possible, but grading services use the worse of front and back measurements.
Q3: Are results identical to official grading?
Tools provide estimates based on published standards. Minor differences can arise from human grader judgment.
Q4: What if borders aren’t clear?
Analyzers perform best on distinct white or colored borders. Full-bleed art may require manual judgment.
Q5: How often should I retake photos?
If centering varies, take multiple straight-on shots with consistent lighting, then average the results.
Q6: Can tools handle all card types?
Leading apps support TCG (Pokémon, Yu-Gi-Oh!, Magic: The Gathering) and sports cards (baseball, basketball).