Optimize Card Layouts with Data-Driven Card Centering Insights
Learn how data-driven card centering insights lead to improved user engagement and business metrics by turning alignment decisions into evidence-based actions.

Estimated reading time: 8 minutes
Key Takeaways
- Data-driven insights transform subjective alignment debates into measurable tests.
- Proper card centering enhances scannability, reduces cognitive friction, and builds trust.
- Robust data collection (analytics, A/B tests, heatmaps) quantifies the impact of alignment variants.
- Tracking visual and behavioral metrics (CLS, CTR, hover rate) guides prioritization and optimization.
- Targeted strategies—design system rules, standardized components, breakpoint testing—drive measurable improvements.
Table of Contents
- Understanding Card Centering
- The Role of Data-Driven Insights
- Methods for Collecting and Analyzing Data
- Key Metrics and Indicators
- Actionable Insights
- Conceptual Case Studies
- Conclusion
- FAQ
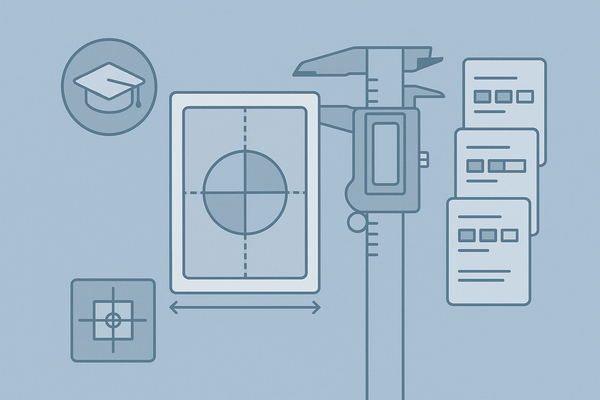
Understanding Card Centering
Defining card centering precisely is the first step toward data-driven insights. It has three facets:
- Visual alignment within cards: ensuring text, images, buttons, and icons follow the intended center or edge alignment.
- Spatial balance between cards: keeping consistent gutters, margins, rows, and columns for even distribution.
- Perceived centering: how users feel a layout is balanced, influenced by typography scale, white space, and visual weight.
According to Nielsen Norman Group, well-designed cards need clear hierarchy, consistent alignment, and predictable layouts to enhance scannability and comprehension. Proper centering helps users locate and process information faster, increasing satisfaction and trust. For a deeper dive into how card centering algorithms work.
Common Challenges in Card Centering
- Subjective “looks right” debates without data can consume hours of team time.
- Responsive breakpoints may align cards on desktop but shift unpredictably on mobile.
- Inconsistent component implementations introduce slight padding or margin variations.
- Misalignment can reduce click-through rates without designers ever knowing.
The Role of Data-Driven Insights
Data-driven insights are conclusions based on systematically collected and analyzed metrics rather than gut feeling. When applied to card centering, these insights help teams:
- Quantify the impact of centering variants (center vs. left-aligned titles, equal-height vs. variable-height cards).
- Link visual alignment changes to user behaviors like click-through rate (CTR), time on task, and conversion.
- Prioritize layout fixes by potential uplift instead of chasing pixel perfection with no return.
Internal research shows that combining quantitative metrics (e.g., CTR, layout shift scores) with qualitative feedback (e.g., usability test transcripts) shifts debates from subjective opinions to objective evidence. Teams adopting these methods iterate faster, validate success, and scale best practices across products.
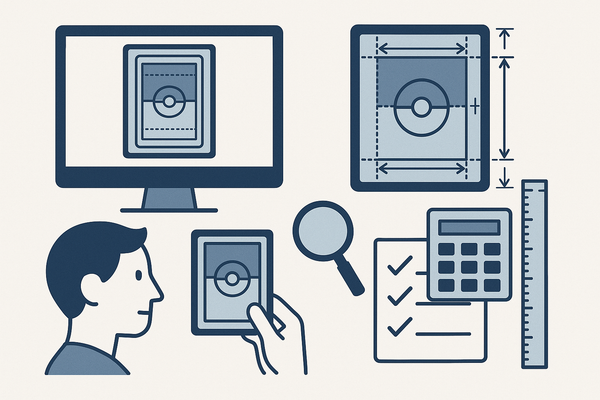
Methods for Collecting and Analyzing Data for Card Centering Performance
To harness data-driven card centering insights, use robust methods for gathering and interpreting data:
Data Collection Methodologies
- Analytics tools
• Track card-level events: clicks, hovers, impressions per variant.
• Log technical metrics: viewport size, load times, cumulative layout shift (CLS). - A/B and multivariate testing
• Randomly assign users to alignment variants: centered vs. left text, tight vs. loose padding.
• Measure impact on CTR, conversion, and engagement. - User testing
• Conduct task-based sessions where participants locate or select cards.
• Observe hesitation or mis-clicks when cards are unevenly spaced. - Heatmaps & session recordings
• Identify click and scroll clusters.
• Detect if misaligned cards are ignored or bypassed. - Surveys & in-product feedback
• Ask users about visual clarity and trust.
• Collect ratings on perceived balance and professionalism.
Data Analysis Techniques
- Descriptive statistics: compute averages and distributions of CTR, hover rate, and time on task by variant.
- Comparative analysis: run significance tests on A/B results to confirm true performance differences.
- Trend identification: monitor metric trajectories post-release for long-term gains.
- Segmentation: break down results by device, browser, and user cohorts.
- Benchmarking: establish thresholds—acceptable pixel deviations or CTR baselines—and compare new releases against them.
Putting it all together:
- Hypothesize that a centering tweak will improve CTR.
- Run A/B tests on desktop and mobile.
- Analyze data segments for significance.
- Gather qualitative comments from surveys.
- Iterate on alignment rules and components.
Key Metrics and Indicators
Tracking the right metrics is essential for effective insights. Divide these into visual-structural and behavioral-outcome metrics:
Visual & Structural Metrics
- Alignment accuracy: pixel or percentage deviation from spec for padding and margin; variance of card heights and widths.
- Layout stability: CLS impact on perceived centering and visual stability.
- Content fit: frequency of text truncation or overflow that disrupts centering.
Behavioral & Outcome Metrics
- Engagement Metrics: CTR per card type; hover rate; dwell time; scroll depth to first interaction.
- Conversion Metrics: add-to-cart and sign-up rates tied to card interactions; revenue per impression.
- Usability Metrics: task success rate; time on task; error rate from mis-clicks due to misalignment.
- Satisfaction Metrics: survey ratings on visual clarity, trust, and professionalism.
How metrics drive action:
- Spot problem areas where misalignment correlates with low CTR.
- Validate if centering changes truly move the needle on conversion.
- Detect device-specific alignment flaws harming mobile users.
- Prioritize experiments on high-impact grids or card types.
To see advanced methods for optimizing centering accuracy.
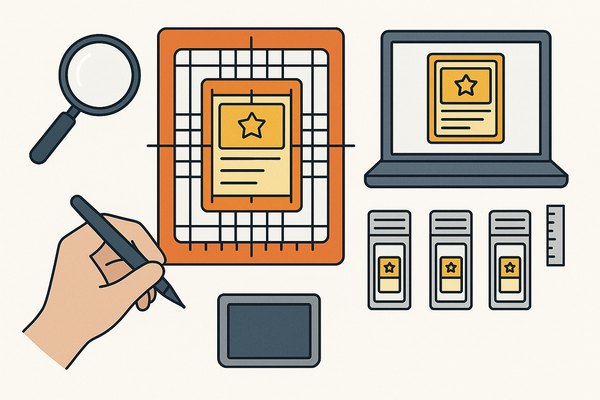
Actionable Insights for Improving Card Centering Performance
Armed with data-driven insights, apply targeted strategies to lift performance:
Strategy 1: Refine Alignment Rules in Design System
- Define spacing tokens, baseline grid increments, and standard padding values.
- Document centering guidelines for each card type: image-heavy product cards, text-focused content cards, pricing comparison cards.
Strategy 2: Standardize Card Components
- Create shared UI components with enforced alignment behavior.
- Integrate visual snapshot tests in CI pipelines to catch regressions.
- Use linting tools for CSS/Sass to validate padding and margin tokens.
Strategy 3: Optimize for Key Devices & Breakpoints
- Analyze analytics to identify top viewport sizes.
- Test centering rules specifically on those breakpoints.
- Adjust font sizes, line heights, and truncation rules for small screens.
Strategy 4: Iterate with Targeted A/B Tests
- Form clear hypotheses, such as:
- “Center-aligned titles will increase mobile CTR by 5%.”
- “Aligning price and CTA on the same baseline row reduces friction.”
- Segment tests by device and user cohort to spot differing effects.
Strategy 5: Address Root Causes
- Set maximum character counts or truncation ellipses for variable text lengths.
- Optimize image dimensions and preload key CSS to prevent layout shift.
For examples of advanced layout techniques using Flexbox, Grid, and JS.
Conceptual Case Studies
E-commerce Grid Improvement
• Issue: Varying image aspect ratios and title lengths created uneven rows and reduced CTR.
• Action: Standardized image ratios, equalized card heights, centered CTAs.
• Result: A/B test showed a 12% lift in product card click-through rate.
Pricing Comparison Cards
• Issue: Recommended plan card was misaligned, causing lower click share.
• Action: Centered plan names, aligned feature bullets, unified CTA baseline.
• Result: Recommended tier click share increased by 18% within two weeks.
Conclusion
Turning card centering from aesthetic guesswork into a performance lever requires data-driven insights. By defining precise alignment rules, systematically collecting and analyzing metrics, and running targeted tests, teams can:
- Boost user engagement and click-through rates
- Enhance visual consistency and trust
- Improve conversion and business outcomes at scale
Adopt these approaches to make every card alignment decision count. Integrate continuous measurement into your design workflows, refine your design system with evidence-backed rules, and watch your layouts deliver measurable value day after day.
For trading card enthusiasts, Card Centering Tool is a web app that measures how well-centered your cards are before you submit them for professional grading.
FAQ
- What is card centering?
Card centering refers to the visual and spatial alignment of UI cards within grids or layouts to create balance and clarity. - Why use data-driven insights for card layouts?
Data-driven methods replace subjective debates with objective evidence, ensuring that alignment changes positively impact engagement and conversion. - Which metrics should I track?
Track visual-structural metrics like alignment accuracy and CLS, and behavioral-outcome metrics such as CTR, hover rate, and task success rate. - How often should I test card centering variants?
Run iterative A/B or multivariate tests whenever you introduce significant layout changes, and re-evaluate after reaching statistical significance. - Can I apply these methods in existing design systems?
Yes. Update your design system documentation, add snapshot tests, and integrate analytics to continuously validate alignment rules.